Devices
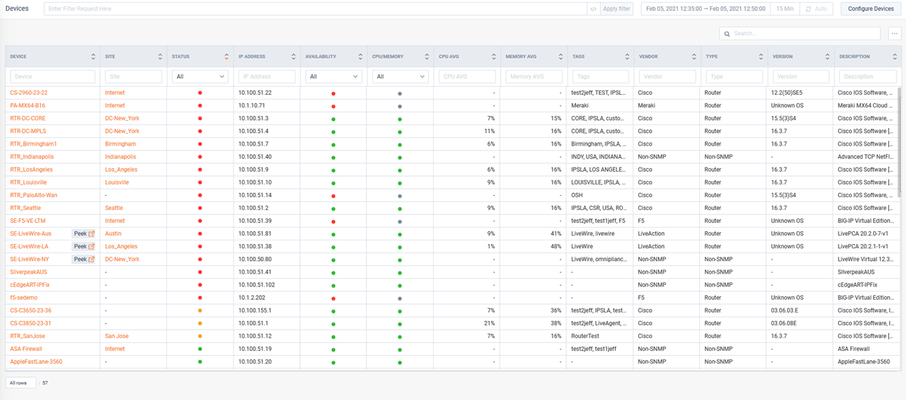
The Devices navigation page presents a list of all devices in LiveNX and highlights a summary of their performance statuses.
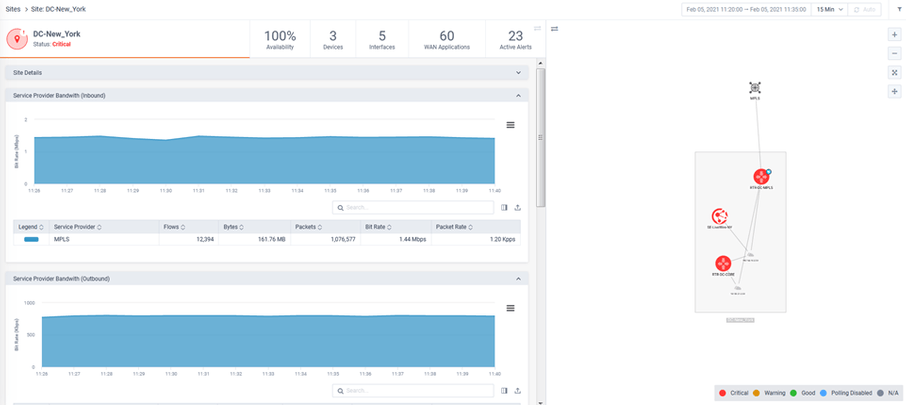
Clicking on a Device will drill-down to the Device’s detail page. Clicking on a Site will drill-down to the Site’s detail page.
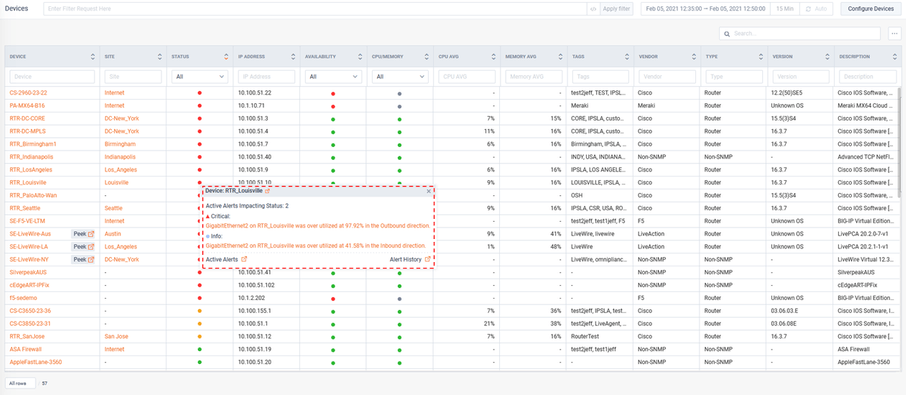
Clicking on a status bubble will provide more details and optional drill-down for further exploration.
LiveAction LiveWire and LiveCapture appliance devices will have an icon to allow cross-launch to Peek (Omnipeek).
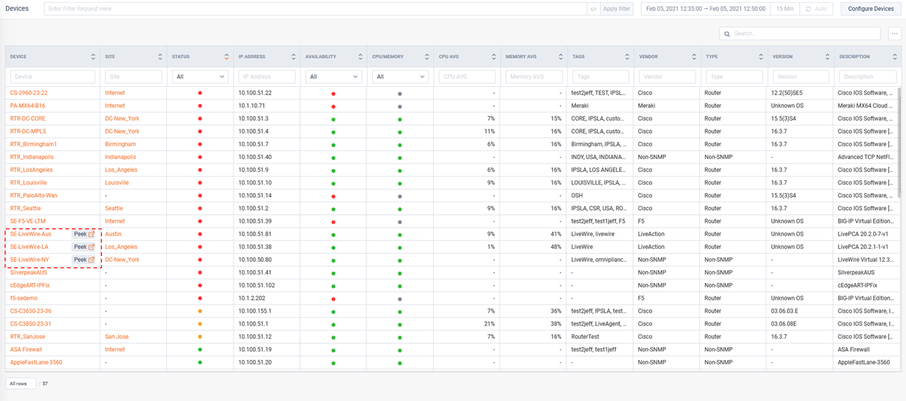
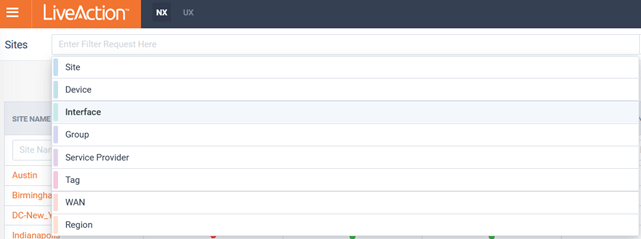
Filters can be applied to focus on the specific entities of interest:
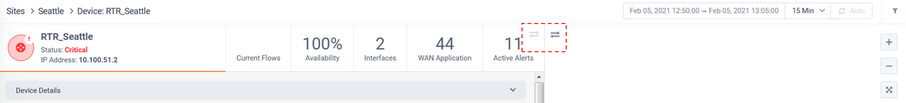
The page can optionally be auto-refreshed by toggling the button in the top right of the page.

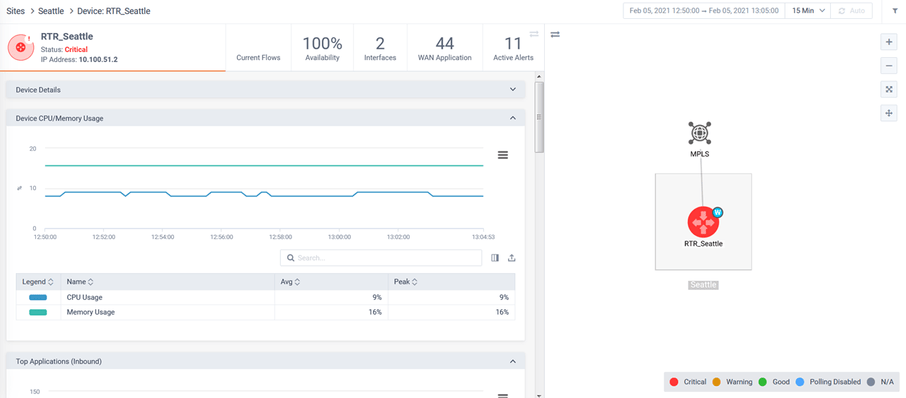
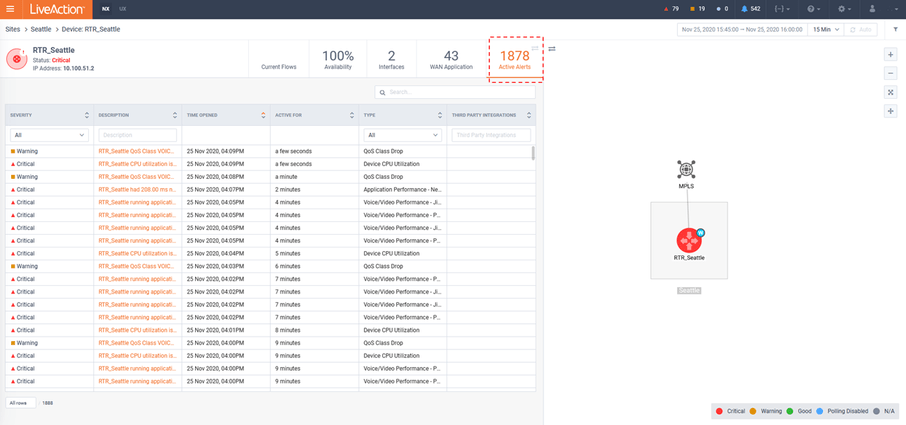
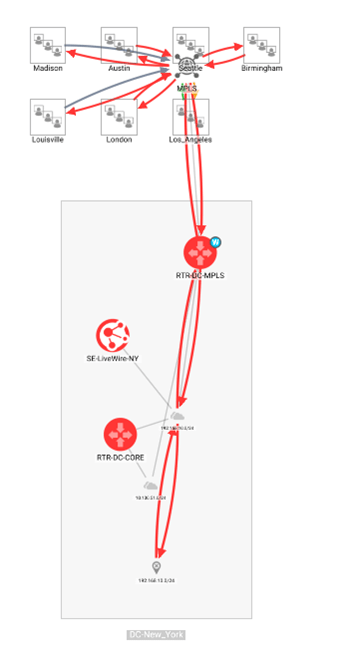
The Device’s detail page has multiple tabs to quickly understand different dimensions of the entity. There is also a simple topology map to provide context of the entity.
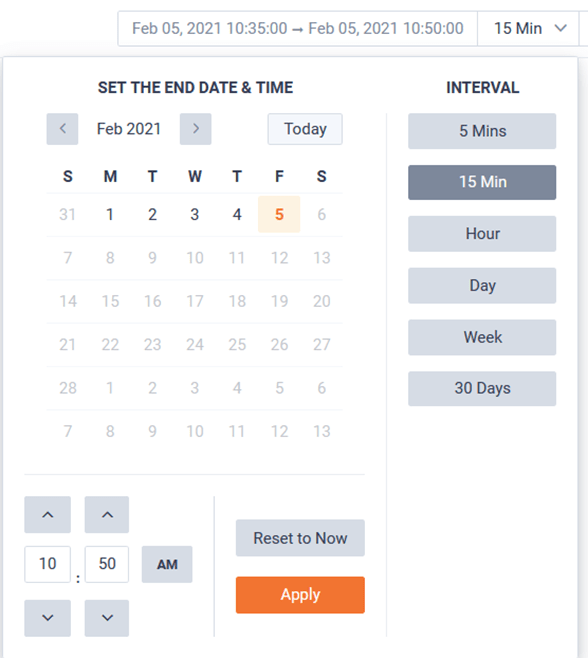
Historic data can be explored on the entity's tabs.
The page can optionally be auto-refreshed by toggling the button in the top right of the page.
The page view can be modified to allow the tabs or topology to be full page.
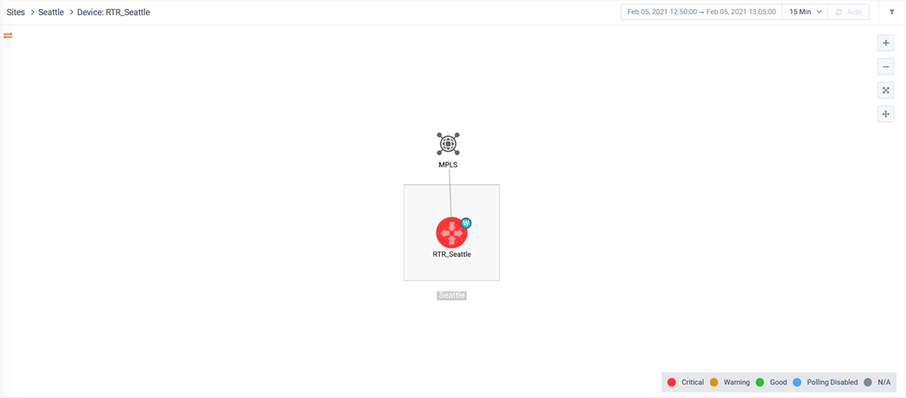
Full page tab view:
Full page Topology view:
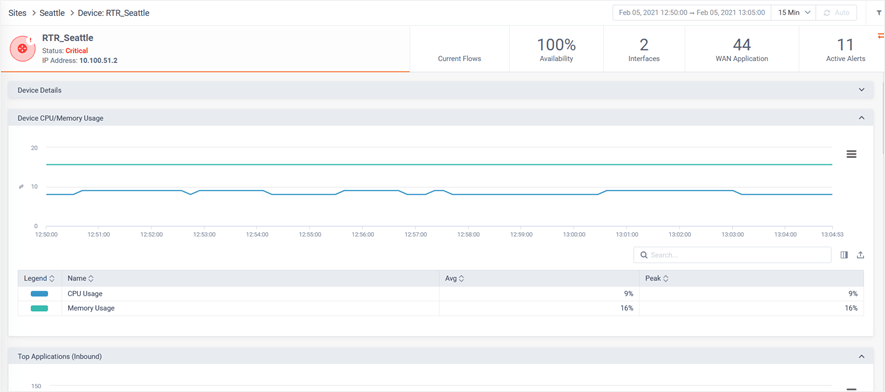
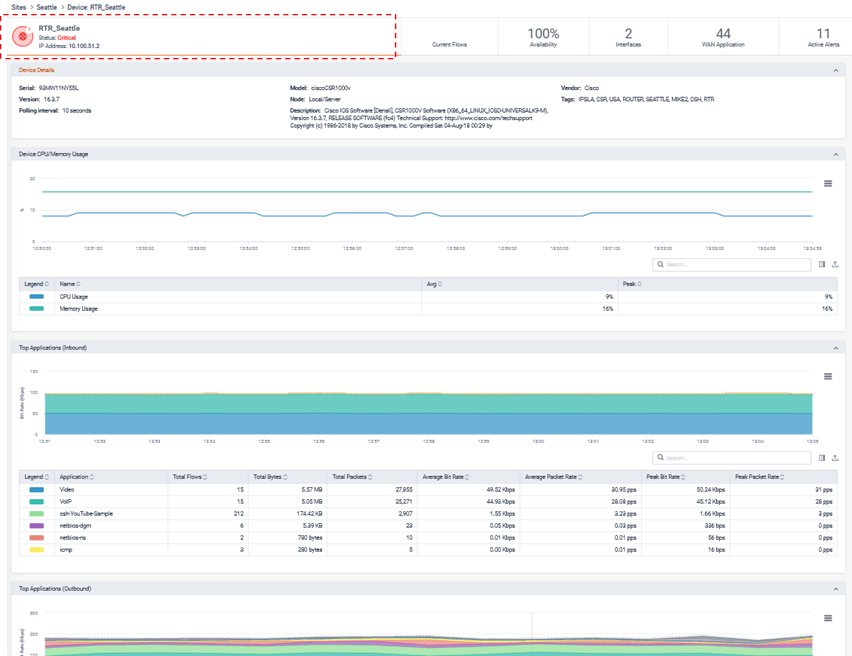
The status tab of the Device page provides a curated list of reports for quick understanding of the Devices’ Status.
These reports include:
• Device Details
• Device CPU/ Memory Usage
• Top Application(Inbound)
• Top Application(Outbound)
• Top DSCP(Inbound)
• Top DSCP(Outbound)
• Top Conversation(Inbound)
• Top Conversation(Outbound)
The Current Flows tab will show the raw flows being received by the device.
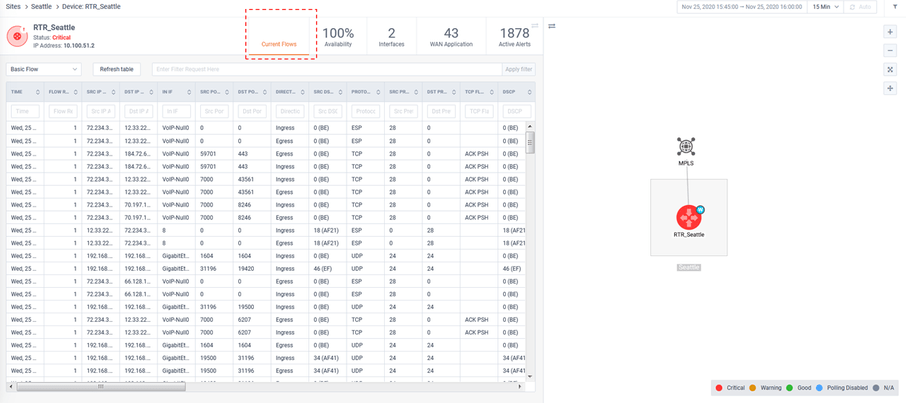
The Flow Type picker will one to focus on the Flow of interest.

The button forces the screen to refresh.

Flex search Filters can be used to focus on the Flow type of interest.

If Auto is selected, flows will automatically be refreshed.

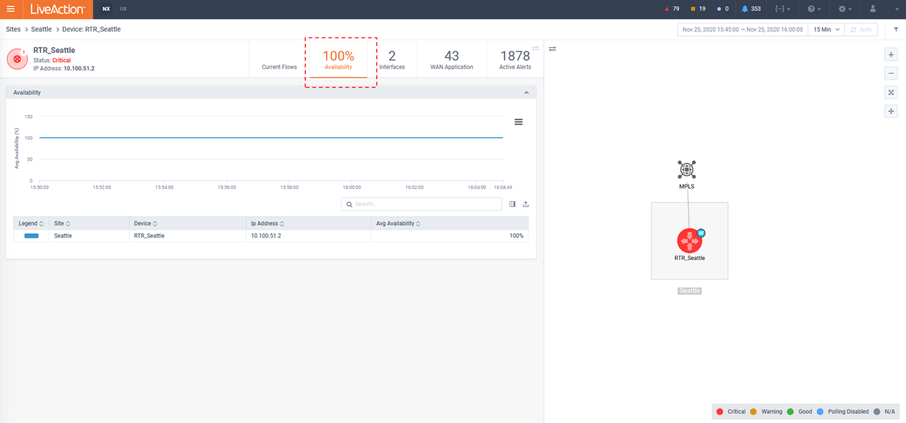
The Availability tab of the Device page provides the Device Availability report.
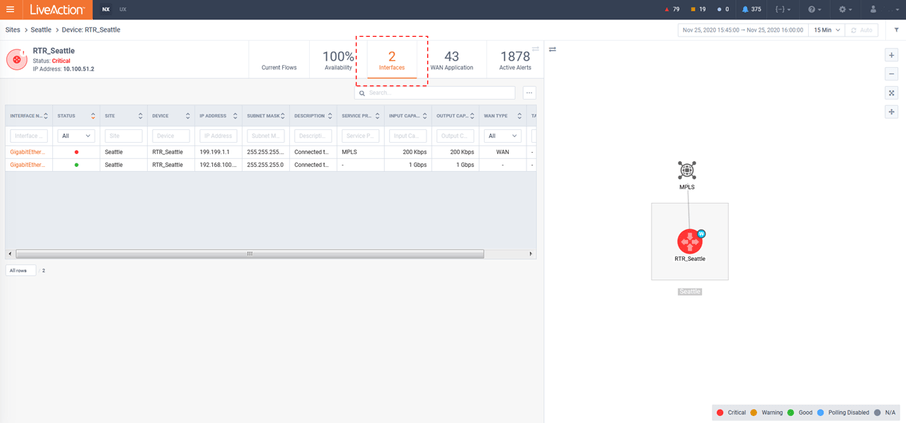
The Interfaces tab of the Devices page provides a list of all monitored interfaces of the devices. Clicking on an interface’s link will drill-down into its details.
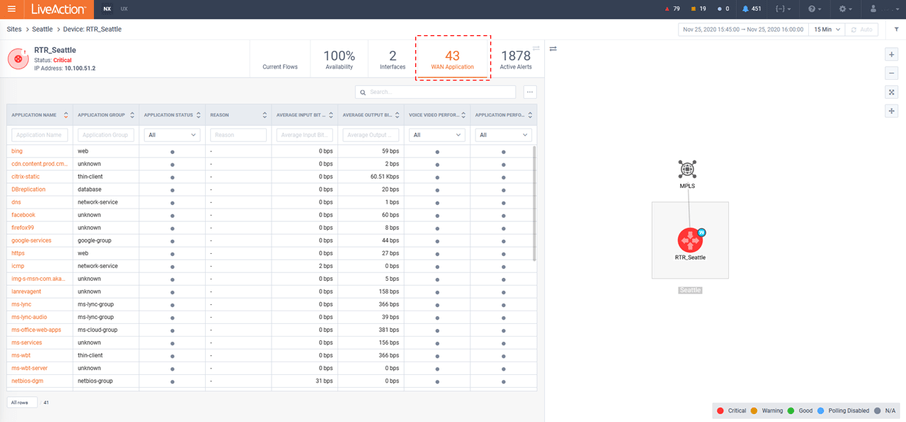
The WAN Application tab of the Device page provides a list of all WAN applications traversing the Device. Clicking on an application will drill-down into its details.
The Active Alerts tab of the Device page provides a list of all active Alerts on the Device. Clicking on an Alert will drill-down into its details.
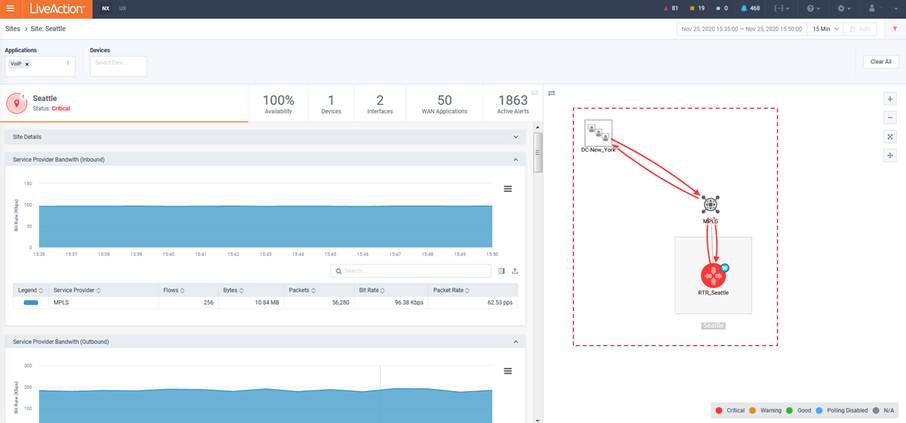
Select the Filter Icon at the top right of the page to see an Application and Devices filter. These only control the topology map. By entering an application(s), Flow will be projected on the topology map. Relevant external sites that are part of the communication with the select application(s) are also shown. Entering a device(s) will highlight those entities.
Click on an external site to be provided an option for .
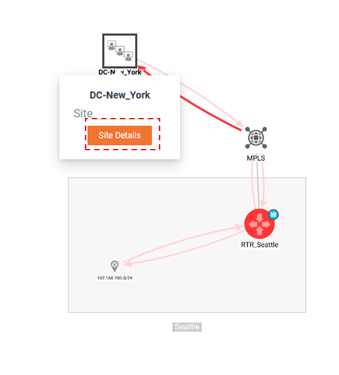
Click the button to drill-down to the details of the other Site.
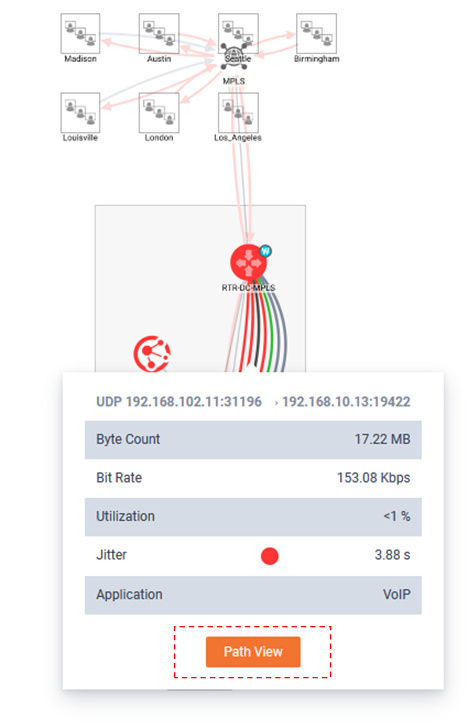
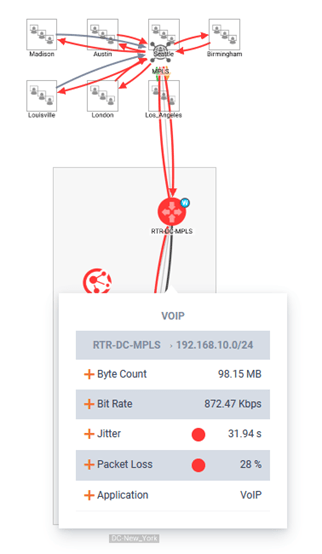
Clicking on a Flow arrow will pop-up details about the application.
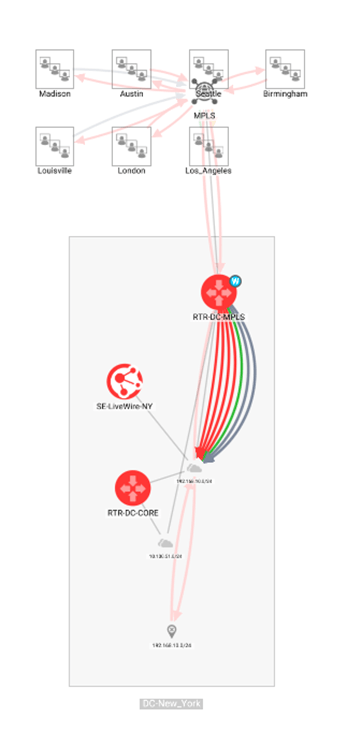
Expand the details to see all flows for the selected segment.
Click on an expanded Flow to see its details.
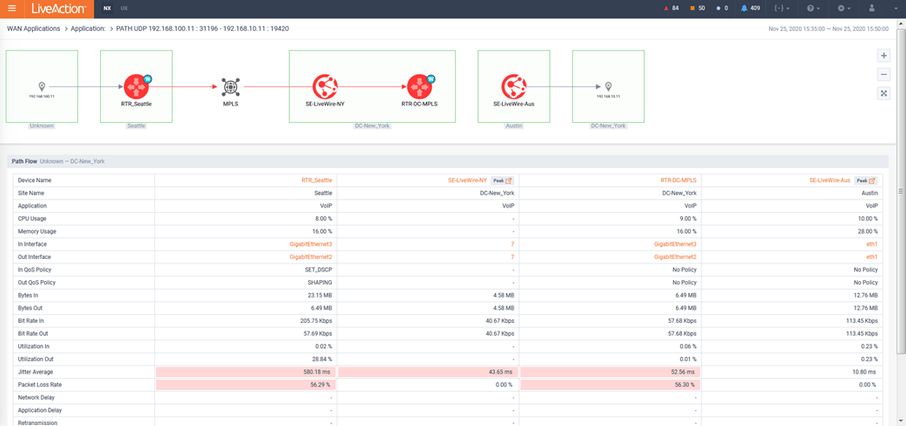
Click for drill-down to Flow Path Analysis.